Disaster Assistance Program Service Design for a Non-Governmental Organization
For a new service and program offering, I facilitated design workshops and research with users and stakeholders to strategize how to help people experiencing life-changing disasters nationwide.
With the rise of climate change, an NGO created a new program requiring service design to expand disaster assistance, serving the most vulnerable clients with long-term recovery needs. With more specific criteria, the new program can now serve clients who may have been previously missed through prior initiatives. Since this service was new, the vision was to design a minimum viable service that focuses on quality outcomes over traditional outputs to learn and plan for future scalability.
Image Credit: Freepik – Pikisuperstar
Service Design Goals
- Reinforce organization’s mission and respond to evolving needs for communities and social change
- Place organization as a player for climate change impact
- Be good stewards of donor financials and support future fundraising efforts
- Modernize a complex service by improving overall workflows to help caseworkers and clients throughout service touchpoints
- Reduce volume of manual work and improve processes for caseworkers
- Enhance client experience while continuing to build trust with clients and partners
- Provide visibility for the future by supporting reporting and tracking processes to help with future service refinement and forecasting for new services
Highlights
- Service is part of flagship org application with 14k users serving 600k+ clients
- New program with service design to place organization as prominent responder for rise of climate change
- First program in organization developed with service and human-centered design
- MVP program released ahead of disaster season to seize learning opportunities for future service design iteration
On this Page
There’s a lot of work I’m proud to share. Continue to browse through or go to a section:
Strategic Service and User Experience Design Activities
Service Design Workshops
Being a new service offering in need of design, my goal was to gather a baseline understanding from our business stakeholders and their teams to help them organize their program and bring clarity to both of our teams. There were no product design touch points as part of this design process.
I designed and facilitated nine workshop activities over four weeks with eighteen participants in fifteen working sessions, totaling twenty-four hours of meeting time to set the foundation for our teams working on the new program.
Lean UX Canvas

Lean UX Canvas and Hypothesis Prioritization Canvas
The Lean UX Canvas, created by author Jeff Gothelf, is a facilitation tool for discussing and documenting outcomes and initial hypotheses to understand the “why” behind the work to be done.
I facilitated this activity to:
- Document program problems and outcomes
- Define users / actors, user outcomes, benefits, and solutions
- Discuss and document hypotheses, what’s most important, and the next most important thing for the team to learn
- Discuss and prioritize hypotheses
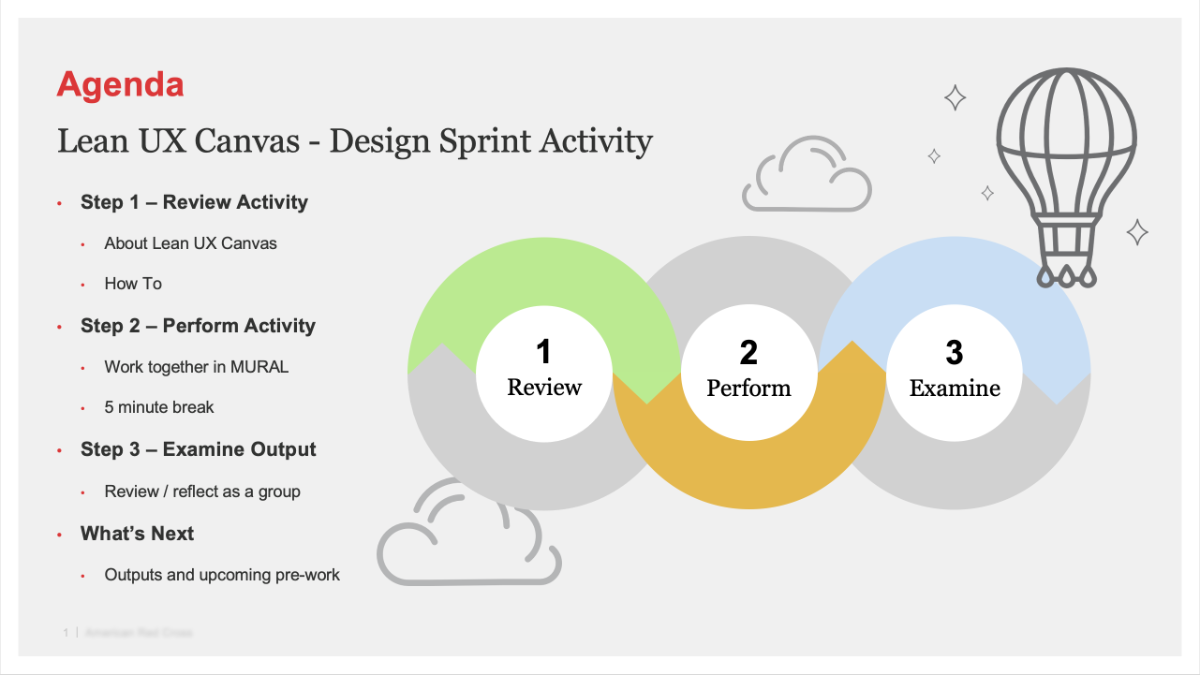
Sample Presentation Slide to Introduce Activity

Sample Presentation Slide to Examine Workshop Output
Program Outcomes
Continuing from Lean UX Canvas outcomes, we took a deeper dive into brainstorming critical program outcomes, data sources, and how / when to measure indicators.
Nine critical program outcomes were identified in consideration of many important aspects including:
- Mission and Organization Impact
- Client Experience
- Workforce Experience
- Business Needs
I love the structure you’re bringing to the user feedback as well as an approach to measure results. It’s going to be game changing.

Program Outcomes Canvas
I created this canvas to extend the Lean UX workshop discussion to document critical outcomes, data sources, how the outcome can be measured, and at what intervals.
Research Framing

Research Framing Activity 1
The first research framing session documented what we think we know, want to know, and list all service users, actors, and stakeholders.

Research Framing Activity 2
The second research framing session covered service / organization objectives, service context and promise, and the most important results to stakeholders.
Meeting as a group, we worked through two research framing activities modeled after Service Design Tools. These workshops were used to define the service’s objectives, context, and goals while helping to understand, prepare, and plan for research opportunities.
In these workshops and discussions, everyone was empowered to:
- Define objectives of the service and organization
- List trends, barriers, restrictions, and conditions
- Discuss service promises including values and answers offered
- Envision what will happen if the service is a success
- Use information from Lean UX Canvas, document the hypotheses to test along with users, actors, and stakeholders
- Document details we think we know and what we still need to learn more about to recognize biases and blind spots
- Clarify users, actors, stakeholders, and other people within the service
- Document facts, objectives, and emotions about people within the service and ideas to best serve these users / actors
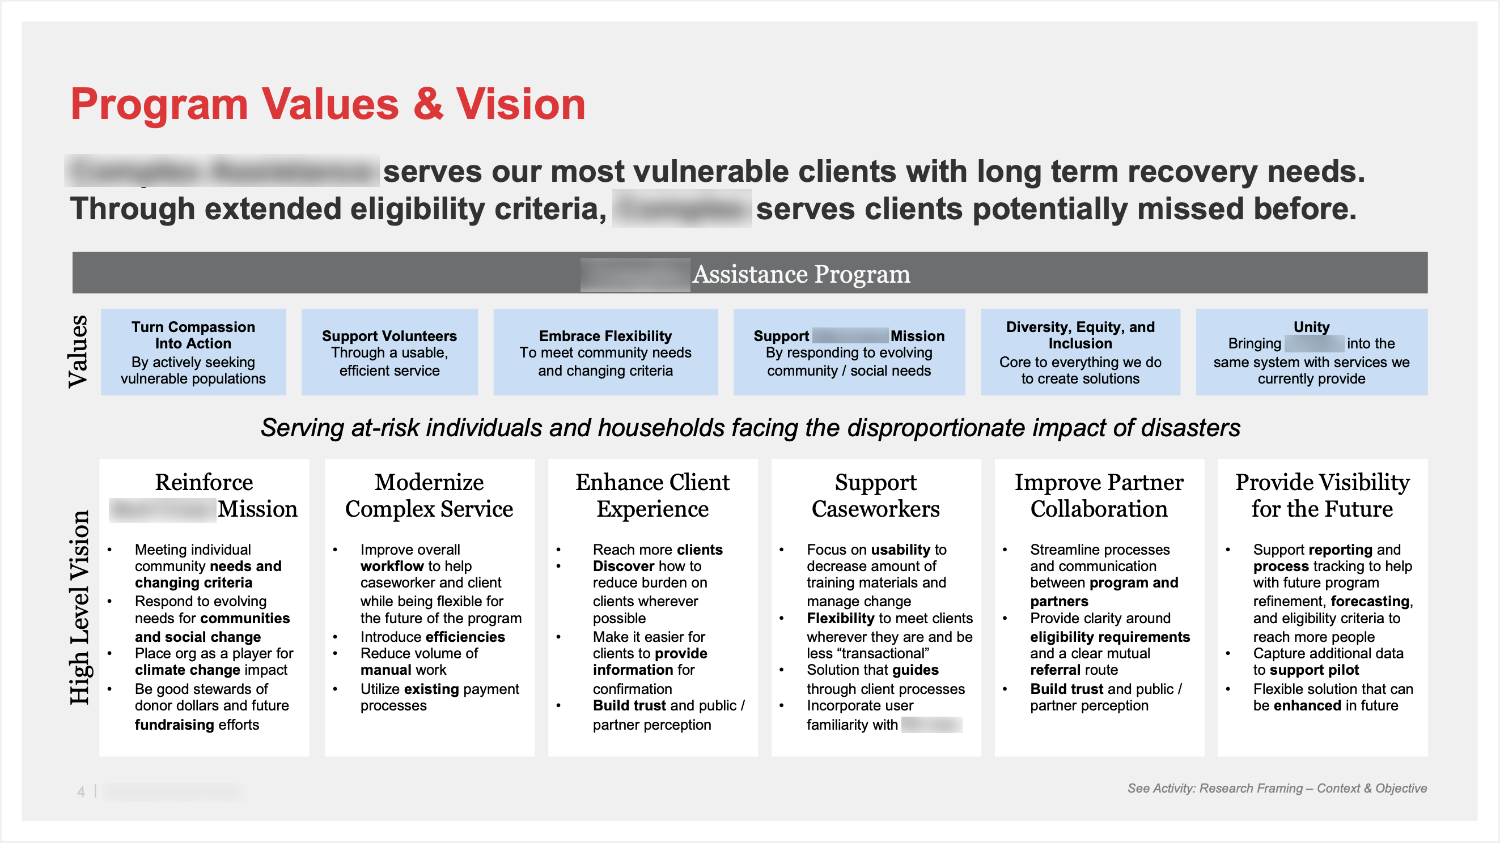
Program Values & Vision – Summary Slide
The new program serves the org’s most vulnerable clients with long term recovery needs. Through extended criteria, the program serves clients potentially missed before.

Important Results for Program – Summary Slide
Stakeholders identified four critical areas of results that were important to them as they launched their new service: Clients, Workforce, Stakeholders, and Program.
Preliminary Personas

Workshop Activity – Preliminary Personas to Start Discussion
As part of assigned pre-work, participants created their own boards documenting the traits for seven different personas. The boards were combined and what they think they already knew about the personas was discussed as a group. As a new person, this was helpful to me and prepared me for design research to create qualitative personas.
User Interviews, Dovetail Coding, and Qualitative Personas

Qualitative Persona – Experienced Shelter Caseworker
Each persona summarizes user behaviors, tasks, goals, pain points, and how we can serve them to build shared team understanding.

Qualitative Persona – Beginner Shelter Caseworker
Each persona summarizes user behaviors, tasks, goals, pain points, and how we can serve them to build shared team understanding.
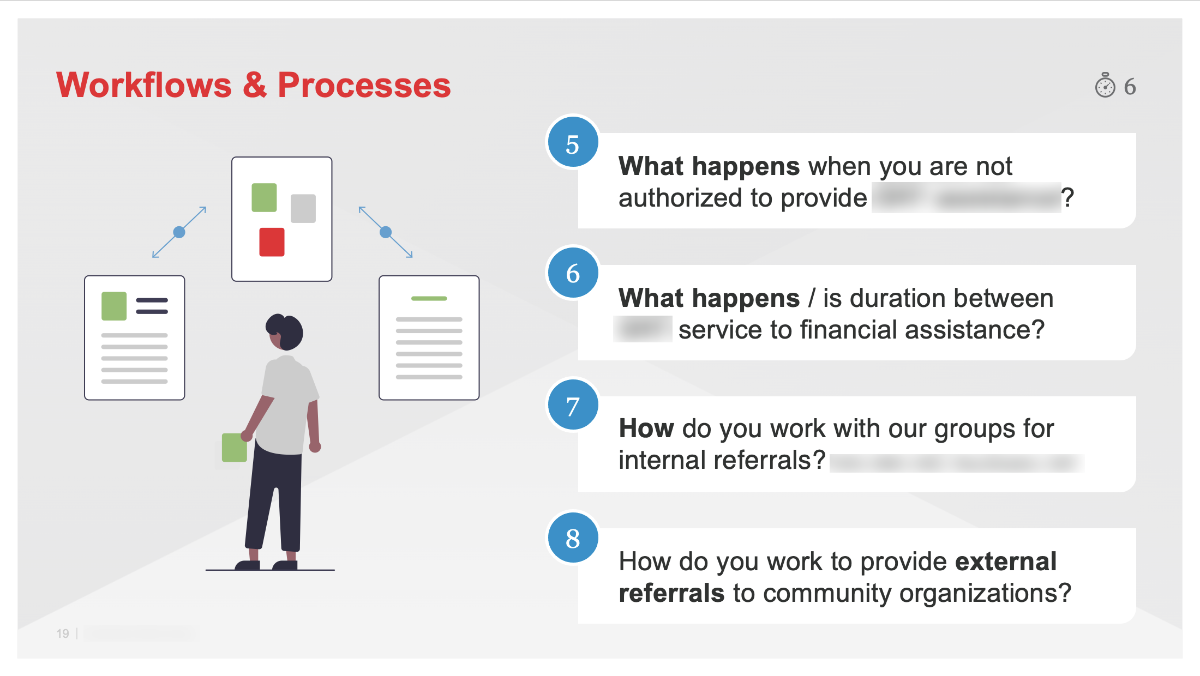
Sample Slide from User Interview Guided Discussion
The user interview discussion guide included questions geared towards learning about their role, technology and tools, product experience, workflows, and future visioning.
Initial actor personas were co-created to quickly discuss key roles. Since these are purely assumption based, they must be challenged and evolve as part of a future ongoing user research plan. Afterwards, I conducted user interviews to create qualitative personas.
Additionally, the preliminary workshop was helpful to me for learning about each role and how the stakeholders and team perceive them before beginning a research plan.
After the preliminary workshop, I started incorporating user research into the roadmap as part of the service touchpoints. Taking a design approach rooted in research, I created and conducted a series of activities to learn more about our users and business problems to solve for outcomes.

Sample Screen View of User Interview Coding in Dovetail App
I used Dovetail to code user interview transcriptions and assign them tags for quick reference, consolidation, and sharing with stakeholders.
- Documented role traits, pain points, and opportunities
- Created for Client, Federal and Non-Federal Disaster Case Managers, Local Community Partner, Caseworker, Casework Supervisor, and Back Office / NHQ Users and Stakeholders
- Provided an idea of who we are designing for to jump start additional research, challenge assumptions, and test hypotheses
- Conducted user interviews with discussion guides and coding / analysis in Dovetail App
- Introduced workshops with participatory design for new features
Empathy Map, Postcards from the Field, Participatory Design

Empathy Map
After user interviews and coding research insights, I created an empathy map for the team as a communication tool to build compassion for the persona.
I am impressed with your workshop today. You did a great job. You were very professional and inclusive. I am confident in your ability to come up with an additional feature that will work for everyone. Looking forward to your finished work.
Your workshop facilitation was excellent.

Sample Artifact – Postcards from the Field
Since everyone is so busy, I created a series of field postcards based on user research as a way to quickly communicate to our development and program teams high-level user feedback. This artifact is helpful alongside in-depth qualitative personas.

Participatory Design with Users – Crazy Eights Activity
As part of designing a new product feature and related service, I created a Crazy Eights activity as a way for users to share what would be most helpful to them in the system.
Rose, Thorn, Bud
Rose, Thorn, Bud was designed to uncover and discuss pain points, likes, and opportunities in the current existing solution so the team could discuss any overlaps and considerations for the new program.
- Documented and discussed positives, negatives, and opportunities that exist in the service and product today
- Discussed similarities within the group
- Will help to guide on potential enhancements and areas requiring additional research
- Included key members from technical team to discuss potential technical debt to be addressed as part of building new program

Rose, Thorn, Bud Activity to Learn About Current State
This easy to understand activity was adapted from Luma Institute.
Design Criteria Canvas

Design Criteria Canvas
The Design Criteria Canvas was a helpful activity for everyone’s voice to be heard about product features and then organizing them into musts, shoulds, coulds, and won’ts. Afterwards, I collaborated with the product manager on prioritization for stories. Through this activity we gained further clarity of the immediate work to be done.
Using the Design Criteria Canvas, we documented an initial design strategy by listing what the design must, should, could, and won’t have to prioritize design criteria for the initial service offering.
- Discussed what the solution must, should, could, and won’t contain as part of the initiative
- Prioritized as a group into one combined canvas
- Will help to guide team on development stories and flows
- Extremely helpful to our product manager during story writing process
I love this process that you are working through with all of us.
Caseworker and Client Service Blueprint

Service Blueprint
In a realtime series of workshop sessions, I facilitated and created a service blueprint of the previous state of the new service. For each pain point I captured notes in Lucidchart.
It was important to examine and discuss pain points and lessons learned from the 2018 version of the program with our business stakeholders and subject matter experts.
The overall process of the program takes place starting with the disaster event date plus 8–12 months. This service blueprint details the caseworker journey and steps they work through for assisting a client with their recovery as part of the program.
Way to be a trailblazer in this field for our organization. I love how rich and information dense the blueprint is while at the same time being easy for almost anyone to get a holistic and especially shared understanding.
- Details the caseworker journey and steps for assisting a client in 2018 on a discontinued program
- Consists of two case initiation types, four stages, and nine steps
- Multiple technologies, backstage actions, and supporting processes involved
- Overall process takes as little as two weeks, though often much longer
- 54 pain points documented; the team used these learnings moving forward to inform how to approach functions and process
- This activity was valuable to build shared understanding and a framework from which to build the new program
Ecosystem Map

Ecosystem Map
This Ecosystem Map was helpful for everyone to visualize all of the entities inside and outside of the organization contributing to the service.
In a vast ecosystem, seven primary personas play unique roles to help clients as part of the new program’s processes.
The ecosystem map shows value exchanges between different entities both in and outside of the organization. This visualization displays primary roles and entities that influence key actors and the broader service environment.
The information gathered was based on a discontinued version of the program in 2018.
- Visualization to picture cause and effect, relationships, and dependencies
- Centers around a client accessing the discontinued version of the program in 2018
- Divided by entities inside (18) and outside (24) of the organization with 42 total
- Visualizes roles and entities influencing key actors and the broader service environment
- Highlights types of exchanges, including information, system, monetary, and other goods
- Excellent artifact to build shared understanding of the service’s ecosystem design
Client Journey Map

Client Journey Map
With many paths to recovery, this journey map visualizes one path of financial assistance recovery after a major disaster like a hurricane.
To get a clear understanding of the client experience, I met with our care team and subject matter experts to map the general client’s journey of receiving another form of assistance similar to the new program we were designing. The process for this included gathering insight from client research transcripts and speaking to workers interacting with clients as part of their recovery.
- Visualization used for illustrating one type of client’s journey during a major disaster like a hurricane
- Maps the interactions in the client’s journey with the organization on their road to recovery
- Showcases emotional storytelling to build empathy among team members and those not directly involved in research processes with clients
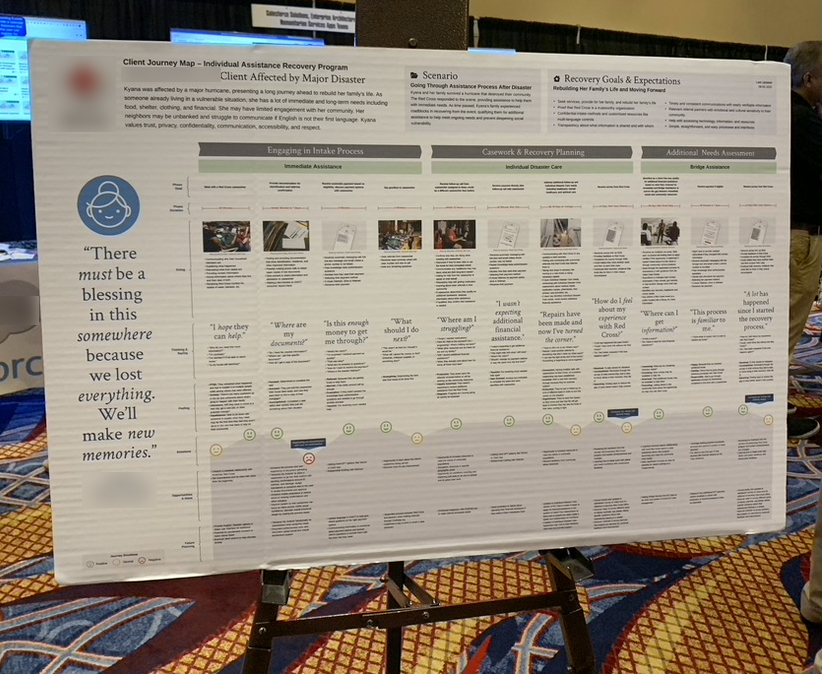
Printed Journey Map on Easel at IT Event
The printed journey map was a great addition to the product booth.
This journey map was professionally printed and displayed at the development team’s Salesforce product booth at the organization’s annual Information Technology Expo in August 2022. This display, in addition to kiosk screens I made for our product demo (below), set the scene as a human-centered design team during our product manager’s presentation to the organization’s CEO.

Landing Screen of IT Event Kiosk
I created an interactive kiosk using Microsoft PowerPoint for the product booth on display at an IT event. Illustrations were provided.